Vertical LinesThis script plots vertical lines on charts or indicators. Unfortunately pinescript is lacking a vertical line plotting function. Vertical lines are useful to mark events, such as crossover of levels, indicators signals or as a time marker.
After searching the internet for a long time and trying different scripts, this script is the simplest and visually the best. You would think that plotting a vertical line would be relatively easy, it is not! I thank the unknow author for sharing this solution and now I will share it on tradingview to make it readily available to anybody that needs it.
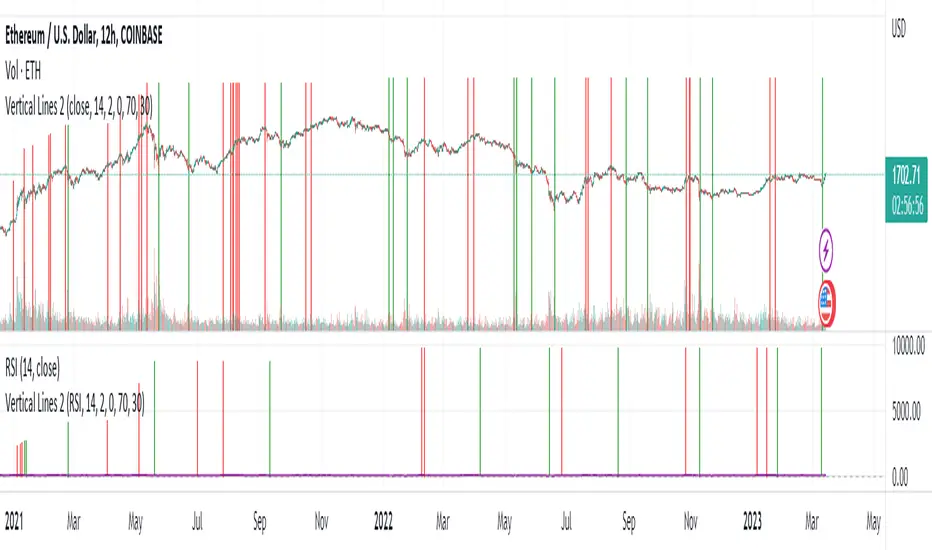
RSI crossover signals are used as an example in this script. When the RSI crosses over 70 or below 30, the script plots a red or green vertical line.
The script plots a vertical line as a histogram bar. The histogram bar must have a height.
Setting the height near infinity like 1e20 will cover all the ranges from top to bottom in most charts, but doesn't work all the time. If the chart range is small in values, the line is not plotted or the chart is visually compressed because the top of the bar is also a data point in the chart. Another solution is to find the highest point in the chart and multiply it by a number from 2 to 10 to set the top of the histogram bar. But this solution doesn't work if the line is drawn in the indicator window. additionally if the chart or indicator includes negative values, a histogram bar with a negative height must be concatenated to the histogram bar with a positive height to cover the positive and negative range.
It would seem intuitive to include a vertical plot function since it is very useful and pinescript already has a horizontal line plot function called Hline. But pinescript is becoming less intuitive, and redundant. A case in point is Version 4 variable declaration and naming, it less intuitive and more redundant than previous versions. I beg Tradingview to adopt a more refined scripting language such as Matlab or Python for charting purposes. These languages can be easily ported to other analysis programs for AI or statistical analysis.
Cerca negli script per "horizontal line"
Qullamaggie Breakout V2After publishing the Qullamaggie Breakout script and seeing that it had some decent results, I wanted to explore it a bit further. There were a few things I didn't like about that methodology that didn't really jive with the way I like to trade. So what I did was combined the Breakout Trend Follower strategy I had been using for entries with the Qullamaggie strategy for trailing stops once in profit. The results seem pretty good to me and an approach that fits my personality and something I can actually trade. Typically better profit than the Breakout Trend Follower by giving more room for your winners to run, while still protecting your entries by moving up the trailing stop until you are in profit, all while taking less trades, so that's great.
Everything is done with stop orders. So you set your buy stop at the recent swing high point and wait for a breakout. Once in a position you set your sell stop at the recent swing low point. The most recent swing high and low are shown on the chart for easy reference with the blue and orange horizontal lines. Once in a trade, trail your sell stop after a new swing low is registered (shown by the thicker orange stop line). Once you are in profit, leave that hard stop level there (the orange line will stay there helping you). Now, you wait for price to cross a Moving Average of your choosing (default is Daily 10 MA). Once the bar crosses that moving average, you move your stop to the low of that candle (shown by the blue stop line) and trail your stop along every crossing of the moving average until the trend changes and takes out your stop. So managing this trade is pretty easy...just wait for the stop lines to move and move your stop with them. It's a great way to trade when you can't be at your computer all the time because the stop orders take care of execution on both buy and sell side. If you use a daily timeframe for your moving averages (the default), you really only need to move stops around about once a day, so is a good part time trader's strategy in my opinion.
The best opportunities will come by scanning for stocks in the longer term timeframe of your moving averages. Wait for a consolidation on that timeframe so the anticipated breakout has some room to run. Once you've identified a good candidate, zoom in to your lower timeframe where the swing highs/lows will act as your entry and exit points, all while keeping the moving averages consistent between timeframes.
Hope you guys find it useful.
A few options available:
- Choose any timeframe for your moving averages, while using swing high/low points on intraday charts.
- Choose one of two moving averages shown for your trailing stops (default 10 and 20 MA).
- Choose to use the third moving average as a filter for keeping you out of trades that are below it (trading with the trend).
- Use the charts resolution candle or the moving average resolution candle for the moving average trailing stop.
- Only take trades where your buy level minus stop level is below a % of the Average Daily Range (ADR). This allows you to potentially have better risk/reward. I added a little table that shows the ADR of the stock/ticker as well as the range between the recent buy and sell levels (shown by the orange and blue horizontal lines) for easy reference.

LB Squeeze Momentum DivergencesThis study tries to highlight LazyBear Squeeze Momentum divergences
as they are defined by
TradingLatino TradingView user
Squeeze momentum green peaks are connected by a line
Associated prices to these green peaks are also connected
If both lines have a different slope orientation
then there is a divergence.
It only shows two last divergence lines and angles.
The original chart screenshot shows some divergence lines
on the top or main chart
these were drawn manually
because you cannot write to two different charts
from the same pine script study (Well, not in August 2020 anyways)
It's aimed at BTCUSDT pair and 4h timeframe.
HOW IT WORKS
Simple geometric mathematics are used
to calculate the two lines degrees
Then both degrees are compared
to show if both lines agree ( // or \\ )
or if they disagree ( /\ or \/ )
SETTINGS
(SQZDiver) Show degrees : Show degrees of each Squeeze Momentum Divergence
lines to the x-axis.
(SQZDiver) Show desviation labels : Whether to show
or not desviation labels for the Squeeze Momentum Divergences.
(SQZDiver) Show desviation lines : Whether to show
or not desviation lines for the Squeeze Momentum Divergences.
(ADX) Smoothing
(ADX) DI Length
(ADX) key level
(ADX) Print : Whether to show
or not scaled ADX line
(SQZMOM) BB Length
(SQZMOM) BB MultFactor
(SQZMOM) KC Length
(SQZMOM) KC MultFactor
(SQZMOM) Use TrueRange (KC)
(SQZMOM) Print : Whether to show
or not Squeeze Momentum indicator.
WARNING
Some securities and timeframes might output degrees
too next to zero.
The code might need to be tweaked to meet your needs.
USAGE
One strategy is to sell when you are in a long entry
when you find out that the price slope is upwards ( / )
while the lb smilb slope is downwards: ( \ )
E.g. You will see:
/
\
on the indicator.
Why?
Because it might signal you that the price is
going to correct downwards soon.
FEEDBACK 1
Please let me know if there is any
other strategy based on the red side of
LB Squeeze Momentum
so that I might add support for it in the future.
FEEDBACK 2
Calculating degrees in a chart
with a different x-axis scale
is a nightmare
that's why I did not a range settings
so that values next to zero are
converted into zero
and thus showing an horizontal line.
Feedback is welcome on this matter.
EXTRA 1
If you turn off showing the divergence lines
and if you turn off showing the divergence labels
you almost get what TradingLatino user uses
as its default momentum indicator.
EXTRA 2
Optionally this indicator can show you
a rescaled ADX (it only works properly on 2020 Bitcoin charts)
ABOUT COLOURS
TradingLatino user has both dark green and light green
inverted compared to this LB SQZMOM chart.
CREDITS
I have reused and adapted some code from
'Squeeze Momentum Indicator' study
which it's from TradingView LazyBear user.
I have reused and adapted some code from
'Directional Movement Index + ADX & Keylevel Support' study
which it's from TradingView console user.

Hancock - IFT RSI T3MAThis is a version of the Inverse Fisher Transform Relative Strength Index with T3MA smoothing and histogram difference based on EMA signal line.
Configurable parameters:
RSI length - This is the period used for the RSI .
RSI Smooth Length - This is the smoothing period of the Weighted Moving Average used for the smoothing in Inverse Fisher Transform .
RSI Signal - This is the period used for EMA signal line.
RSI Overbought - Configures the overbought threshold (0.5 default).
RSI Oversold - Configures the oversold threshold (-0.5 default).
T3 Smoothing - Enabling this applies T3MA smoothing to the RSI .
T3 Length - This is the period used for the T3MA smoothing of the RSI .
T3 Factor - This is the factor used for the T3MA smoothing of the RSI .
I've added a histogram plotting the difference between the signal line and RSI to make it easier to make trades. Oversold and Overbought thresholds are indicated by the red and green horizontal lines. Signal line is coloured for trade direction.
Happy trading folks!
Hancock

SMA Reversal Sequential MTF - Pure Confirmed Final V2SMA Reversal Sequential MTF - Detailed Indicator Manual
This indicator identifies trend reversal points based on the shape of a Simple Moving Average (SMA) and monitors these signals across multiple timeframes (MTF). By synchronizing trends from various intervals, it provides a robust framework for identifying high-probability entry points.
1. Core Logic Overview
The indicator detects "peaks" and "troughs" in the SMA to identify potential reversal points.
Bullish Reversal (UP): Occurs when the SMA turns upward after a period of decline (forming a "trough").
Bearish Reversal (DN): Occurs when the SMA turns downward after a period of inclination (forming a "peak").
In addition to detecting these turns, the indicator tracks the high/low prices of the most recent reversal points on a "Confirmed Bar" basis. When the current price breaks these levels, it confirms a trend continuation or a breakout.
2. Full Description of Input Settings
Basic Settings / Main Settings
Use Short Period (5, 4, 7) / 短期設定を使用:
true: Increases sensitivity to price movements by using shorter parameters (e.g., SMA 5). Suitable for scalping.
false: Uses standard parameters (e.g., SMA 20). Suitable for day trading and swing trading.
Timeframe Visibility / 時間足表示設定
Allows individual toggling of visibility for each timeframe's labels and lines.
Show 1M to 1m / 1M〜1m表示: Individually enable or disable the calculation and display of data for Monthly (1M), Weekly (1W), Daily (Daily), 4H, 1H, 15M, 5M, and 1m timeframes.
Hide Higher TF Settings on Lower TFs / 下位足での上位設定を非表示: When enabled, this removes lower timeframe data from higher timeframe charts to reduce visual noise.
Drawing Options / 表示オプション
Show Only Current TF Labels / 現在足のラベルのみ表示: If enabled, only labels corresponding to the chart's current interval (e.g., "5" labels on a 5M chart) will be displayed.
Show Trendlines & Channels / トレンドライン&チャネルを表示: Automatically draws trendlines and parallel channels by connecting recent local reversal points on the current timeframe.
Show Sequential Labels / 転換点ラベル表示: Displays timeframe labels (e.g., "15", "1H") at the exact point where the SMA reversed.
Show Break Lines / ブレイクライン表示: Draws horizontal lines from the most recent peaks or troughs and displays a "BREAK" label when price crosses them.
Break Label Offset / ブレイク文字の右オフセット: Adjusts the horizontal distance of the "BREAK" label from the current bar for better visibility.
Additional Alert Settings / 追加アラート設定
Alert 1: Current + 2 Higher TFs Sync (Blue/Red) / アラート1: 現在・上位2つ同調:
Triggers a notification when the trend (UP/DN) of the current chart's timeframe, the next higher timeframe, and the second higher timeframe all align.
Alert 2: 4-TF Sync Including Current (Orange) / アラート2: 表示足を含む4足同調:
Triggers a notification when four consecutive timeframes (Current + 3 Higher) align in the same direction. This is considered a high-conviction signal.
3. How to Read the Dashboard (Table)
The compact table in the top-right corner displays the current trend status for key timeframes in real-time.
Blue Background (UP): Indicates price has broken the recent peak, confirming an uptrend for that timeframe.
Red Background (DN): Indicates price has broken the recent trough, confirming a downtrend for that timeframe.
Gray Background: Indicates the trend status is yet to be determined or is in a neutral state.
The table items are fixed to show 1D, 4H, 1H, 15M, and 5M from top to bottom. When all rows turn the same color, it indicates a strong market trend across the entire spectrum.
4. Key Feature: MTF Sync Alerts
The primary advantage of this indicator is its automation of manual Multi-Timeframe Analysis.
3-TF Sync: On a 15M chart, if the 15M, 1H, and 4H trends align, a small Blue (Buy) or Red (Sell) label appears on the chart.
4-TF Sync: If the alignment extends to a 4th timeframe (e.g., up to the Daily timeframe on a 15M chart), an Orange label is displayed, signaling a very strong trend confluence.
このインジケーター(SMA Reversal Sequential MTF)は、移動平均線(SMA)の形状からトレンドの転換点を特定し、それを複数の時間足(MTF)で監視・同期させることで、高精度なエントリーポイントを探るためのツールです。
以下に、すべてのインプット項目を含む詳細な説明をまとめました。
1. 概要と基本ロジック
このインジケーターは、SMA(単純移動平均線)が「山」や「谷」を作ったポイントを転換点として認識します。
上昇転換: SMAが一定期間、下降した後に上昇へ転じた(谷を作った)タイミング。
下降転換: SMAが一定期間、上昇した後に下降へ転じた(山を作った)タイミング。
これに加えて、直近の転換点の価格(高値・安値)を「確定足」で更新し、そのラインを価格がブレイクした際にトレンドの継続や転換を判定します。
2. インプット項目の詳細
基本設定 / Main Settings
短期設定を使用 (5, 4, 7):
true(チェックあり): 短期的な動きに敏感になります(SMA 5期間など)。スキャルピング向け。
false(チェックなし): 標準的な設定(SMA 20期間など)。デイトレード・スイング向け。
時間足表示設定 / Timeframe Visibility
各時間足のラベルやラインを表示するかどうかを個別に設定します。
1M〜1m表示: 月足(1M)から1分足(1m)まで、各MTFデータの計算・表示をオン/オフします。
下位足での上位設定を非表示: * 現在表示しているチャートより上位の時間足設定だけを表示し、ノイズを減らすためのスイッチです。
表示オプション / Drawing Options
現在足のラベルのみ表示: チェックすると、チャートの時間足と一致するラベル(例:5分足チャートなら「5」のラベル)のみ表示されます。
トレンドライン&チャネルを表示: 現在表示している足の直近の転換点同士を結び、トレンドラインと並行チャネルを自動描画します。
転換点ラベル表示: SMAが反転した位置に「15」や「1H」などの時間足ラベルを表示します。
ブレイクライン表示: 直近の転換点(高値・安値)から右側に水平線を引き、そこを価格が抜けた際に「BREAK」の文字を表示します。
ブレイク文字の右オフセット: 「BREAK」ラベルを右側にどれくらい離して表示するかを調整します。
追加アラート設定 / GRP_NEW_AL
アラート1: 現在・上位2つ同調 (青/赤):
「表示中の足 + 1つ上 + 2つ上」の計3つのトレンド(UP/DN)が一致した瞬間に通知します。
アラート2: 表示足を含む4足同調 (オレンジ):
「表示中の足 + 上位3つ」の計4つのトレンドがすべて一致した強力なサイン時に通知します。
3. テーブル(ダッシュボード)の見方
画面右上に表示されるコンパクトなテーブルは、各時間足の現在のトレンド状態をリアルタイムで示しています。
青背景(UP): 直近で高値をブレイクし、上昇トレンドにある状態。
赤背景(DN): 直近で安値をブレイクし、下降トレンドにある状態。
灰背景: 状態が未確定なケース。
表示項目は上位足から順に 1D(日足), 4H, 1H, 15M, 5M となっており、これらが一色に染まるタイミングが環境認識上の強いトレンドを示唆します。
4. 特徴的な機能:MTF同調アラート
このインジケーターの最大の強みは、手動でのマルチタイムフレーム分析を自動化している点です。
3足同調(SYNC): 15分足チャートであれば「15M・1H・4H」が同じ方向を向いた時にチャート上に青(買い)または赤(売り)の小さなラベルが表示されます。
4足同調(4-TF SYNC): さらに上位の足(15分足なら日足まで)が同調すると、オレンジ色のラベルが表示され、より強い根拠となります。

QUARTERS THEORY XAUUSDThe “Quarter Theory XAUUSD” indicator on TradingView is designed to automatically plot horizontal price levels in $25 increments on your chart, providing traders with a clear visual representation of key psychological and technical price points. These levels are particularly useful for instruments like XAU/USD, where price often reacts to round numbers, forming support and resistance zones that can be leveraged for both scalping and swing trading strategies. By showing all $25 increments as horizontal white lines, the indicator ensures that traders can quickly identify potential entry and exit points, without the need for manual drawing or repeated calculations.
The indicator works by calculating the nearest $25 multiple relative to the current market price and then drawing horizontal lines across the chart for all increments within a defined range. This range can be customized to suit the instrument being traded; for example, for gold (XAU/USD), a typical range might extend from 0 to 5000, covering all practical price levels that could be relevant in both high and low market conditions. By using Pine Script’s persistent variables, the indicator efficiently creates these lines only once at the start of the chart, avoiding unnecessary resource usage and preventing TradingView from slowing down, which can happen if lines are redrawn every bar.
From a trading perspective, these levels serve multiple purposes. For scalpers, the $25 increments act as micro support and resistance points, helping to determine short-term price reactions and potential breakout zones. Scalpers can use these levels to enter positions with tight stop-loss orders just beyond a level and take profits near the next $25 increment, which aligns with common price behavior patterns in highly liquid instruments. For swing traders, the same levels provide broader context, allowing them to identify areas where price might pause or reverse over several days. Swing traders can use these levels to align trades with the prevailing trend, particularly when combined with other indicators such as moving averages or trendlines.
Another key advantage of the Quarterly Levels indicator is its simplicity and visual clarity. By plotting lines in a uniform white color and extending them to the right, the chart remains clean and easy to read, allowing traders to focus on price action and market dynamics rather than cluttered technical drawings. This visual consistency also helps in backtesting and strategy development, as traders can quickly see how price interacts with each level over time. Additionally, the use of round-number increments leverages the psychological tendencies of market participants, as many traders place stop orders or entry points near these levels, making them natural zones of interest.
Overall, the Quarterly Levels indicator combines efficiency, clarity, and practical trading utility into a single tool. It streamlines chart analysis, highlights meaningful price zones, and supports both scalping and swing trading approaches, making it an essential addition to a trader’s toolkit. By understanding how to integrate these levels into trading strategies, traders can make more informed decisions, manage risk effectively, and identify high-probability trade setups across various market conditions.

Enhanced MTF Bias Table by Odegos# Enhanced MTF Bias Table - Publication Description
## Short Description (for TradingView listing)
Multi-timeframe bias indicator combining Market Structure Shifts (MSS) with EMA analysis. Displays real-time bias across 7 timeframes (5m-Weekly) with distance metrics and volatility measurements. Perfect for identifying trend alignment and potential reversal points.
---
## Full Description
### Overview
The **Enhanced MTF Bias Table** is a comprehensive multi-timeframe analysis tool designed to help traders quickly identify market bias across different time horizons. By combining Market Structure Shift (MSS) detection with Exponential Moving Average (EMA) analysis, this indicator provides a clear, color-coded view of market sentiment from short-term (5-minute) to long-term (weekly) timeframes.
### What This Indicator Does
**Core Functionality:**
- **Multi-Timeframe Analysis**: Simultaneously monitors 7 different timeframes (5m, 15m, 30m, 1h, 4h, Daily, Weekly)
- **Market Structure Detection**: Identifies when price breaks previous swing highs/lows, indicating potential trend changes
- **EMA-Based Bias**: Combines market structure with price distance from a customizable EMA to determine bias strength
- **Visual Market Structure Shifts**: Draws horizontal lines on the chart when significant market structure shifts occur
- **Real-Time Metrics**: Displays distance from EMA and ATR (volatility) for each timeframe
### How It Works
**Bias Calculation Logic:**
The indicator uses a sophisticated two-factor approach to determine market bias:
1. **Market Structure Analysis**:
- Tracks swing highs and lows using pivot points
- Identifies when price breaks above previous highs (bullish structure) or below previous lows (bearish structure)
- Uses a customizable lookback period to filter noise
2. **EMA Distance Analysis**:
- Measures how far price is from the selected EMA
- Strong bias requires BOTH structure break AND significant distance from EMA
- Neutral zone prevents false signals when price consolidates near the EMA
**Bias Categories:**
- **Strong ↑** (Dark Green): Bullish market structure + price above EMA threshold
- **Weak ↑** (Light Green): Bullish structure OR price moderately above EMA
- **Neutral** (Orange): Price within neutral zone around EMA
- **Weak ↓** (Light Red): Bearish structure OR price moderately below EMA
- **Strong ↓** (Dark Red): Bearish market structure + price below EMA threshold
### Key Features
**📊 Customizable Table Display:**
- Two table styles: Compact (minimal) or Full (detailed with labels)
- 9 position options to fit any chart layout
- Toggle distance from EMA and ATR displays
- Shows current symbol, timeframe, and date
**📈 Flexible Indicator Settings:**
- Adjustable EMA length (default: 50)
- Customizable MSS lookback period (5-50 bars)
- Breakout threshold adjustment for different instruments
- Neutral zone configuration to reduce noise
**📍 Visual Market Structure Shifts:**
- Draws horizontal lines at significant structure breaks
- Customizable colors for bullish/bearish MSS
- Optional text labels ("MSS") for easy identification
- Adjustable line width and style (solid, dashed, dotted)
**📉 EMA Overlay:**
- Optional EMA display on chart
- Full customization: color, width, line style
- Helps visualize the reference point for bias calculations
**🎨 Full Color Customization:**
- Independent color controls for all bias levels
- Customize header and table appearance
- Matches any chart theme or preference
### Best Use Cases
**1. Trend Alignment:**
Use the MTF table to identify when multiple timeframes align in the same direction. When 5-6 or more timeframes show the same bias, it indicates strong directional momentum.
**2. Divergence Detection:**
Look for disagreements between timeframes. For example, if higher timeframes (Daily/Weekly) show bearish bias while lower timeframes (5m/15m) show bullish bias, it may indicate a counter-trend bounce or potential reversal setup.
**3. Entry Timing:**
Use higher timeframe bias for direction and lower timeframe bias for entry timing. Enter trades when your trading timeframe aligns with higher timeframe bias.
**4. Risk Management:**
When lower timeframes show opposite bias to higher timeframes, it suggests trading against the major trend—requiring tighter stops and smaller positions.
**5. Market Structure Confirmation:**
The MSS lines help identify key levels where market structure changed, useful for:
- Stop loss placement (below/above MSS levels)
- Target setting (previous structure points)
- Breakout confirmation
### Recommended Settings by Instrument
**Index Futures:**
- **ES (S&P 500)**: Breakout Threshold: 0.15%, Neutral Zone: 0.15%
- **NQ (Nasdaq)**: Breakout Threshold: 0.25%, Neutral Zone: 0.20%
- **YM (Dow Jones)**: Breakout Threshold: 0.20%, Neutral Zone: 0.20%
**Forex Pairs:**
- **Major Pairs**: Breakout Threshold: 0.10%, Neutral Zone: 0.10%
- **Volatile Pairs**: Breakout Threshold: 0.20%, Neutral Zone: 0.15%
**Cryptocurrencies:**
- Breakout Threshold: 0.30-0.50%, Neutral Zone: 0.25-0.40%
- Higher volatility requires larger thresholds
### Understanding the Metrics
**Distance from EMA (%):**
- Positive values = Price above EMA (bullish territory)
- Negative values = Price below EMA (bearish territory)
- Larger absolute values = Stronger deviation from mean
- Useful for identifying overextended moves
**ATR (%):**
- Measures current volatility as percentage of price
- Higher values = More volatile conditions
- Helps adjust position sizing and stop distances
- Compare across timeframes to see where volatility concentrates
### Tips for Optimal Use
1. **Start with higher timeframes**: Check Daily and Weekly bias first to understand the bigger picture
2. **Use the 50 EMA default**: It's widely used and provides reliable support/resistance
3. **Adjust MSS lookback for your style**: Lower values (5-7) for day trading, higher values (15-25) for swing trading
4. **Watch for neutral zones**: Orange/neutral readings often precede significant moves
5. **Combine with price action**: Use MSS lines as reference points for entries and exits
6. **Don't ignore weak signals**: "Weak" bias often precedes strong moves as structure builds
### What Makes This Different
Unlike simple moving average indicators, this script:
- Combines TWO confirmation factors (structure + distance) for more reliable signals
- Provides context across multiple timeframes simultaneously
- Visually marks important market structure changes on your chart
- Offers both compact and detailed display modes
- Includes volatility measurement to gauge market conditions
### Technical Notes
- Uses `request.security()` to fetch data from multiple timeframes
- Implements `pivothigh()` and `pivotlow()` for swing detection
- All calculations use `lookahead=barmerge.lookahead_off` to prevent repainting
- MSS lines drawn in real-time as structure breaks occur
- Optimized for performance with minimal script resources
### Disclaimer
This indicator is a tool for analysis and does not provide trading signals or financial advice. Always:
- Use proper risk management
- Combine with other forms of analysis
- Test thoroughly in a demo environment
- Understand that past performance doesn't guarantee future results
- Consider market conditions and fundamental factors
---
## Tags (for TradingView)
multi-timeframe, market-structure, bias, trend, EMA, momentum, support-resistance, price-action, volatility, ATR, swing-trading, day-trading
## Category
Trend Analysis / Multi-Timeframe Analysis
---
## Quick Start Guide
**For Day Traders:**
1. Add indicator to your chart
2. Focus on 5m, 15m, 30m, and 1h timeframes
3. Look for alignment across these timeframes
4. Use MSS lines as entry/exit reference points
**For Swing Traders:**
1. Add indicator to your chart
2. Focus on 4h, Daily, and Weekly timeframes
3. Wait for 2-3 timeframe alignment
4. Use lower timeframes only for entry timing
**For Position Traders:**
1. Add indicator to your chart
2. Focus on Daily and Weekly timeframes
3. Ignore short-term noise
4. Enter when both show same strong bias

PDH/PDL + PSH/PSL + Session Opens (UTC+10)PDH / PDL (Previous Day High/Low)
“Day” = your trade day that starts at Asia open 09:00 Brisbane.
At each new Asia open, it:
Locks yesterday’s high/low as PDH/PDL
Draws two horizontal lines labeled PDH and PDL
PSH / PSL (Previous Session High/Low)
Tracks the High/Low of each session:
Asia 09:00–17:00
London 18:00–23:00
NY Futures 23:00–00:30
NYSE 00:30–01:00
When a session ends, it stores that high/low.
At the next session open, it prints the previous session levels:
At London open → shows PSH/PSL ASIA
At NY Futures open → shows PSH/PSL LON
At NYSE open → shows PSH/PSL NY
At Asia open → shows PSH/PSL NYSE
Session open markers (vertical lines)
Draws an opaque-ish vertical line + tiny label at:
09:00 “ASIA 09:00”
18:00 “LON 18:00”
23:00 “NY 23:00”
00:30 “NYSE 00:30”
Line behavior
Horizontal lines extend to the right by extendBars (default 500 bars).
Labels are small and minimal (left-anchored on the line).

Enterprise value / Revenue / Gross margin [robust]The Problem with EV / Revenue
Standard valuation metrics like EV/Revenue can be misleading for high-growth companies. While investors frequently use it to value SaaS or Tech stocks, it ignores the critical role of Gross Margins.
Example: A company trading at 10x Revenue with 80% margins is significantly "cheaper" than a company trading at 10x Revenue with only 40% margins.
The Solution: This script combines both metrics into a single "Efficiency Multiple" (EV / Gross Profit), giving you a true "Price per Dollar of Profit" view.
How It Works (The Math)
Instead of viewing two separate charts, this indicator calculates a single efficiency ratio:
Ratio = Enterprise Value / Gross Profit
Data Source: It pulls Fiscal Quarter (FQ) data to create a clean, "stepped" visualization that matches professional financial terminals.
Smart Labels: It automatically detects every new quarter and prints the exact valuation multiple on the chart, making it easy to see historical trends at a glance.
How to Use It
Use this to find fair value in high-growth stocks where traditional P/E ratios are not yet useful.
Value Zone (< 10x): Marked by a Green Dashed Line. The stock is potentially undervalued relative to its gross profit generation.
Premium Zone (> 20x): Marked by a Red Dashed Line. The stock is trading at a premium. This is common for hyper-growth leaders but implies high future expectations.
Key Features
Crash Proof: Uses raw ENTERPRISE_VALUE and GROSS_PROFIT data with error handling to prevent "Symbol Resolve" errors common with other custom scripts.
Quarterly Steps: Plots data in distinct quarterly steps rather than a noisy daily line, providing a clear fundamental view.
Visual Valuation Zones: Built-in horizontal lines at 10x and 20x to frame the valuation context instantly.
Disclaimer: This tool is for educational purposes only and does not constitute financial advice.

Rate Trail IndicatorRate Trail Indicator Precision Trailing Stop & Multi-Timeframe Highs
Description The Rate Trail Indicator V2 is a professional-grade risk management tool designed to declutter your charts while providing precise, dynamic stop-loss levels. Unlike traditional indicators that paint a continuous "trail" or history across the chart, this script utilizes a Single Line visual approach. It draws only the currently active stop-loss level as a distinct horizontal line, keeping your workspace clean and focused on current price action.
This updated version now includes extensive Multi-Timeframe (MTF) Support, allowing you to overlay key Intraday and Higher Timeframe (HTF) highs directly on your chart.
Key Features Clean "Single Line" Visuals: Removes historical noise by plotting only the active stop-loss level and a dedicated price label. Dual Logic Modes: Percentage Mode: Classic trailing stop based on a percentage drop from the high. Renko Mode: Volatility-based stop that counts exact "Bricks" (supports decimals like 1.5 bricks). Dynamic Reset: The stop trails the "Lifetime High" of the current trend. If the stop is breached, it automatically resets to the current price to begin a new trail immediately. MTF High Breakout Levels: Optional toggles to display previous Intraday Highs (2H, 4H, 6H, 12H) and Historical Highs (1W, 2W, 1M, 3M). Rolling 3-Month Logic: The 3M level now uses a "Rolling" lookback (Highest of the last 3 monthly candles) rather than a fixed calendar quarter, ensuring the data is always recent and relevant. Full Customization: Control line styles (Solid, Dashed, Dotted), colors, and widths for every level independently via the inputs.
How to Use & Settings
1. Main Trailing Stop Setup Configure your primary risk line (Red Line) in the "Main Trailing Stop" group. Stop-Loss Mode: Select Percentage for standard equity/crypto trading (e.g., 2% trail) or Renko Boxes for Renko charts. Renko Boxes Down: Enter the number of bricks to trail. You can use decimals (e.g., 1.5) for fine-tuning. Use Fixed Lookback?: Unchecked (Default): The script tracks the "Infinite High" since the last reset. This is ideal for catching long trends. Checked: The script only looks at the highest price of the last X bars. This creates a more "rolling" stop-loss.
2. Intraday & Historical Highs (Resistance/Breakout) Enable up to eight additional lines to see where the price peaked on other timeframes. These act as strong breakout or resistance levels. Intraday Highs: Show the high of the previous 2H, 4H, 6H, or 12H session. 1W / 1M Highs: The highest price of the previous Week or Month. 2W High: The highest price of the last 2 Weeks . 3M High (Updated): The highest price of the last 3 Months (Rolling). This updates monthly, ensuring you aren't looking at data that is 6 months old.
3. Alerts You can set specific alerts to automate your trading or get notified instantly. Main Stop Breached: Fires when price closes below your trailing stop line. MTF High Cross: Fires when price crosses under any of the enabled Intraday or HTF High levels (2H, 4H, 1W, 3M, etc.).

Pivot Point Zones [JOAT]Pivot Point Zones — Multi-Formula Pivot Levels with ATR Zones
Pivot Point Zones calculates and displays traditional pivot points with five formula options, enhanced with ATR-based zones around each level. This creates more practical trading zones that account for price noise around key levels—because price rarely reacts at exact mathematical levels.
What Makes This Indicator Unique
Unlike basic pivot point indicators, Pivot Point Zones:
Offers five different pivot calculation formulas in one indicator
Creates ATR-based zones around each level for realistic reaction areas
Pulls data from higher timeframes automatically
Displays clean labels with exact price values
Provides a comprehensive dashboard with all levels
What This Indicator Does
Calculates pivot points using Standard, Fibonacci, Camarilla, Woodie, and more formulas
Draws horizontal lines at Pivot, R1-R3, and S1-S3 levels
Creates ATR-based zones around each level for realistic price reaction areas
Displays labels with exact price values
Updates automatically based on higher timeframe closes
Provides fills between zone boundaries for visual clarity
Pivot Formulas Explained
// Standard Pivot - Classic (H+L+C)/3 calculation
pp := (pivotHigh + pivotLow + pivotClose) / 3
r1 := 2 * pp - pivotLow
s1 := 2 * pp - pivotHigh
r2 := pp + pivotRange
s2 := pp - pivotRange
// Fibonacci Pivot - Uses Fib ratios for level spacing
r1 := pp + 0.382 * pivotRange
r2 := pp + 0.618 * pivotRange
r3 := pp + 1.0 * pivotRange
// Camarilla Pivot - Tighter levels for intraday
r1 := pivotClose + pivotRange * 1.1 / 12
r2 := pivotClose + pivotRange * 1.1 / 6
r3 := pivotClose + pivotRange * 1.1 / 4
// Woodie Pivot - Weights current close more heavily
pp := (pivotHigh + pivotLow + 2 * close) / 4
// TD Pivot - Conditional based on open/close relationship
x = pivotClose < pivotOpen ? pivotHigh + 2*pivotLow + pivotClose :
pivotClose > pivotOpen ? 2*pivotHigh + pivotLow + pivotClose :
pivotHigh + pivotLow + 2*pivotClose
pp := x / 4
Formula Characteristics
Standard — Classic pivot calculation. Balanced levels, good for swing trading.
Fibonacci — Uses 0.382, 0.618, and 1.0 ratios. Popular with Fibonacci traders.
Camarilla — Tighter levels derived from range. Excellent for intraday mean-reversion.
Woodie — Weights current close more heavily. More responsive to recent price action.
TD — Conditional calculation based on open/close relationship. Adapts to bar type.
Zone System
Each pivot level includes an ATR-based zone that provides a more realistic area for potential price reactions:
// ATR-based zone width calculation
float atr = ta.atr(atrLength)
float zoneHalf = atr * zoneWidth / 2
// Zone boundaries around each level
zoneUpper = level + zoneHalf
zoneLower = level - zoneHalf
This accounts for market noise and helps avoid false breakout signals at exact level prices.
Visual Features
Pivot Lines — Horizontal lines at each calculated level
Zone Fills — Transparent fills between zone boundaries
Level Labels — Labels showing level name and exact price (e.g., "PP 45123.50")
Color Coding :
- Yellow: Pivot Point (PP)
- Red gradient: Resistance levels (R1, R2, R3) - darker = further from PP
- Green gradient: Support levels (S1, S2, S3) - darker = further from PP
Color Scheme
Pivot Color — Default: #FFEB3B (yellow) — Central pivot point
Resistance Color — Default: #FF5252 (red) — R1, R2, R3 levels
Support Color — Default: #4CAF50 (green) — S1, S2, S3 levels
Zone Transparency — 85-90% transparent fills around levels
Dashboard Information
The on-chart table (bottom-right corner) displays:
Selected pivot type (Standard, Fibonacci, etc.)
R3, R2, R1 resistance levels with exact prices
PP (Pivot Point) highlighted
S1, S2, S3 support levels with exact prices
Inputs Overview
Pivot Settings:
Pivot Type — Formula selection (Standard, Fibonacci, Camarilla, Woodie, TD)
Pivot Timeframe — Higher timeframe for OHLC data (default: D = Daily)
ATR Length — Period for zone width calculation (default: 14)
Zone Width — ATR multiplier for zone size (default: 0.5)
Level Display:
Show Pivot (P) — Toggle central pivot line
Show R1/S1 — Toggle first resistance/support levels
Show R2/S2 — Toggle second resistance/support levels
Show R3/S3 — Toggle third resistance/support levels
Show Zones — Toggle ATR-based zone fills
Show Labels — Toggle price labels at each level
Visual Settings:
Pivot/Resistance/Support Colors — Customizable color scheme
Line Width — Thickness of level lines (default: 2)
Extend Lines Right — Project lines forward on chart
Show Dashboard — Toggle the information table
How to Use It
For Intraday Trading:
Use Daily pivots on intraday charts (15m, 1H)
Pivot point often acts as the day's "fair value" reference
Camarilla levels work well for intraday mean-reversion
R1/S1 are the most commonly tested levels
For Swing Trading:
Use Weekly pivots on daily charts
Standard or Fibonacci formulas work well
R2/S2 and R3/S3 become more relevant
Zone boundaries provide realistic entry/exit areas
For Support/Resistance:
R levels above price act as resistance targets
S levels below price act as support targets
Zone boundaries are more realistic than exact lines
Multiple formula confluence adds significance
Alerts Available
DPZ Cross Above Pivot — Price crosses above central pivot
DPZ Cross Below Pivot — Price crosses below central pivot
DPZ Cross Above R1/R2 — Price breaks resistance levels
DPZ Cross Below S1/S2 — Price breaks support levels
Best Practices
Match pivot timeframe to your trading style (Daily for intraday, Weekly for swing)
Use zones instead of exact levels for more realistic expectations
Camarilla is best for mean-reversion; Standard/Fibonacci for breakouts
Combine with other indicators for confirmation
— Made with passion by officialjackofalltrades

15M Swing Sweep Lines + SMT (ES vs NQ)15M Swing Sweep Lines (NY Killzones)Visualize liquidity sweeps of 15-minute swing highs/lows exclusively during high-impact London & New York killzones.This ICT-inspired indicator detects when price sweeps (wicks beyond) the most recent confirmed 15-minute swing high or low — classic signs of liquidity raids or stop hunts — but only if the sweep happens during key "killzone" sessions where institutional activity is typically highest.Key Features15M Swing Detection: Uses confirmed pivot highs/lows (length 2) on the 15-minute timeframe for reliable structure points.
Killzone Filters (New York time):London Killzone: 3:00 AM – 4:59 AM
New York Killzone: 9:30 AM – 10:59 AM (captures the high-volatility NY open overlap)
Sweep Visualization:Bearish Sweep (high > last 15M swing high): Thick red horizontal line from the swing point to the sweep bar.
Bullish Sweep (low < last 15M swing low): Thick green horizontal line from the swing point to the sweep bar.
Lines use xloc.bar_time for precise placement and extend only to the bar where the sweep occurs.
No duplicates: Prevents multiple lines for the same swing sweep.
Non-repainting logic with lookahead_off for clean, trustworthy signals.
Why Killzones MatterMany ICT/SMC traders focus on these windows because they often feature aggressive manipulation, equal highs/lows sweeps, and the setup for strong directional moves. This tool helps you instantly spot when buy-side or sell-side liquidity has been raided on the 15M structure during these prime times.Ideal ForConfirming potential reversals or inducements after liquidity grabs.
Adding confluence to entries during London or NY sessions.
Futures traders (ES, NQ, etc.) looking for clean visual cues of smart money engineering.
Lightweight, overlay-friendly, and focused — add it to your chart for clearer insight into 15M liquidity sweeps when it matters most. Perfect companion for killzone-based strategies!

Unmitigated MTF High Low Pro - Cave Diving Bookmap Heatmap Plot
Unmitigated MTF High Low Pro - Cave Diving Bookmap Heatmap Plot
---
## 📖 Table of Contents
1. (#what-this-indicator-does)
2. (#core-concepts)
3. (#visual-components)
4. (#the-cave-diving-framework)
5. (#how-to-use-it-for-trading)
6. (#settings--customization)
7. (#best-practices)
8. (#common-scenarios)
---
## What This Indicator Does
The **Unmitigated MTF High Low v2.0** tracks unmitigated (untouch) high and low levels across multiple timeframes, helping you identify key support and resistance zones that the market hasn't revisited yet. Think of it as a sophisticated memory system for price action - it remembers where price has been, and more importantly, where it *hasn't been back to*.
### Why "Unmitigated" Matters
In futures trading, especially on instruments like NQ and ES, the market has a tendency to revisit levels where liquidity was left behind. An "unmitigated" level is one that hasn't been touched since it was formed. These levels often act as magnets for price, and understanding their age and proximity gives you a significant edge in:
- **Entry timing** - Waiting for price to approach tested levels
- **Exit planning** - Taking profits before ancient resistance/support
- **Risk management** - Avoiding entries when approaching multiple old levels
- **Liquidity mapping** - Visualizing where orders likely cluster
---
## Core Concepts
### 1. **Sessions & Age**
The indicator uses **New York trading sessions** (6:00 PM to 5:59 PM NY time) as the primary time measurement. This aligns with how futures markets naturally segment their activity.
**Age Categories:**
- 🟢 **New (0-1 sessions)** - Fresh levels, recently formed
- 🟡 **Medium (2-3 sessions)** - Tested by time, gaining significance
- 🔴 **Old (4-6 sessions)** - Highly significant, survived multiple days
- 🟣 **Ancient (7+ sessions)** - Extreme significance, major support/resistance
The longer a level remains unmitigated, the more significant it becomes. Think of it like compound interest - time adds weight to these zones.
### 2. **Multi-Timeframe Tracking**
You can set the indicator to track high/low levels from any timeframe (default is 15 minutes). This means you're watching for unmitigated 15-minute highs and lows while trading on, say, a 1-minute or 5-minute chart.
**Why this matters:**
- Higher timeframe levels have more weight
- You can see multiple timeframe structure simultaneously
- Helps you avoid fighting larger timeframe momentum
### 3. **Mitigation**
A level becomes "mitigated" (deactivated) when price touches it:
- **High levels** are mitigated when price reaches or exceeds them
- **Low levels** are mitigated when price reaches or goes below them
Once mitigated, the level disappears from view. The indicator only shows you the untouch levels that still matter.
---
## Visual Components
### 📊 The Dashboard Table
Located in the corner of your chart (configurable), the table shows:
```
┌─────────┬───────────┬────────┬─────┬───────┐
│ Level │ Price │ Points │ Age │ % │
├─────────┼───────────┼────────┼─────┼───────┤
│ ↑↑↑↑↑ │ 21,450.25 │ +45.50 │ 8 │ +0.21%│ ← 5th High (Ancient)
│ ↑↑↑↑ │ 21,430.00 │ +25.25 │ 5 │ +0.12%│ ← 4th High (Old)
│ ↑↑↑ │ 21,420.50 │ +15.75 │ 3 │ +0.07%│ ← 3rd High (Medium)
│ ↑↑ │ 21,412.00 │ +7.25 │ 1 │ +0.03%│ ← 2nd High (New)
│ ↑ ⚠️ │ 21,408.25 │ +3.50 │ 0 │ +0.02%│ ← 1st High (Proximity Alert!)
├─────────┼───────────┼────────┼─────┼───────┤
│ 15 mins │ 🟢 │ Δ 8.75 │ 2U │ │ ← Status Row
├─────────┼───────────┼────────┼─────┼───────┤
│ ↓ ⚠️ │ 21,399.50 │ -5.25 │ 0 │ -0.02%│ ← 1st Low (Proximity Alert!)
│ ↓↓ │ 21,395.00 │ -9.75 │ 2 │ -0.05%│ ← 2nd Low (Medium)
│ ↓↓↓ │ 21,385.25 │ -19.50 │ 4 │ -0.09%│ ← 3rd Low (Old)
│ ↓↓↓↓ │ 21,370.00 │ -34.75 │ 6 │ -0.16%│ ← 4th Low (Old)
│ ↓↓↓↓↓ │ 21,350.75 │ -54.00 │ 9 │ -0.25%│ ← 5th Low (Ancient)
├─────────┼───────────┼────────┼─────┼───────┤
│ 📊 15↑ / 12↓ │ ← Statistics (optional)
└─────────┴───────────┴────────┴─────┴───────┘
```
**Reading the Table:**
- **Level Column**: Number of arrows indicates position (1-5), color shows age
- **Price**: The actual price level
- **Points**: Distance from current price (+ for highs, - for lows)
- **Age**: Number of full sessions since creation
- **%**: Percentage distance from current price
- **⚠️**: Proximity alert - price is within threshold distance
- **Status Row**: Shows timeframe, direction (🟢 bullish/🔴 bearish), tunnel width (Δ), and Strat pattern
### 📈 Visual Elements on Chart
**1. Level Lines**
- Horizontal lines showing each unmitigated level
- **Color-coded by age**: Bright colors = new, darker = older, deep purple/teal = ancient
- **Line style**: Customizable (solid, dashed, dotted)
- Automatically turn **yellow** when price gets close (proximity alert)
**2. Price Labels**
- Show the exact price and age: "21,450.25 (8d)"
- Fixed at small size for clean readability
- Positioned with configurable offset from current bar
**3. Bands (Optional)**
- Shaded zones between pairs of unmitigated levels
- Default: Between 1st and 2nd levels (the "tunnel")
- Can switch to 1st-3rd, 2nd-3rd, or disable entirely
- **Upper band** (pink/maroon) - Between unmitigated highs
- **Lower band** (blue/teal) - Between unmitigated lows
- These represent the "no man's land" or consolidation zones
---
## The Cave Diving Framework
This indicator is designed around the **Cave Diving Trading Framework** - a psychological and technical approach that maps cave diving safety protocols to futures trading risk management.
### 🤿 The Core Metaphor
**Cave diving has clear danger zones based on depth and overhead environment. Your trading should too.**
#### Shallow Water (New Levels, 0-1 Sessions)
- **Light**: Bright colors (bright red highs, bright green lows)
- **Psychology**: Fresh territory, recently tested
- **Trading**: Be aware but not overly concerned
- **Cave Diving Parallel**: You can see the surface, easy exit
#### Penetration Depth (Medium Levels, 2-3 Sessions)
- **Light**: Medium intensity colors
- **Psychology**: Building significance, market memory forming
- **Trading**: Start respecting these levels for entries/exits
- **Cave Diving Parallel**: Deeper in, need to track your line back
#### Deep Dive Zone (Old Levels, 4-6 Sessions)
- **Light**: Dark colors (deep maroon, dark blue)
- **Psychology**: Highly tested support/resistance
- **Trading**: Major decision points, plan accordingly
- **Cave Diving Parallel**: Significant overhead, careful navigation required
#### Overhead Environment (Ancient Levels, 7+ Sessions)
- **Light**: Very dark, purple/deep teal
- **Psychology**: Extreme caution required, major liquidity zones
- **Trading**: These are your "turn back" signals - don't fight ancient levels
- **Cave Diving Parallel**: Maximum danger, no room for error
### 🎯 The Proximity Alert System
Just like a cave diver's depth gauge that warns at critical thresholds, the proximity alerts (⚠️) tell you when you're entering a danger zone. When price gets within your configured threshold (default 5 points), the indicator:
- Highlights the level in **yellow** on the chart
- Shows **⚠️** in the table
- Signals: "You're entering a high-significance zone - adjust your position accordingly"
This prevents the trading equivalent of going deeper into a cave without checking your air supply.
---
## How to Use It for Trading
### 🎯 Entry Strategies
**1. The "Bounce Setup" (Mean Reversion)**
- Wait for price to approach an old or ancient unmitigated level
- Look for confluence: multiple levels nearby, bands narrowing
- Enter when price shows rejection (reversal candle patterns)
- **Example**: Price drops to a 6-session-old low, shows bullish engulfing → Long entry
**2. The "Break and Retest" (Trend Following)**
- Wait for price to break through an unmitigated level (mitigates it)
- Enter on the retest of the newly broken level
- **Example**: Price breaks above 4-session-old high → Wait for pullback to that level → Long entry
**3. The "Tunnel Trade" (Range Trading)**
- When bands are active, trade the range between 1st-2nd levels
- Short near upper band resistance, long near lower band support
- Exit at opposite side or when bands break
### 🚨 Risk Management Rules
**The Ancient Level Rule**
> Never fight ancient levels (7+ sessions). If you're long and approaching an ancient high, take profits. If you're short and approaching an ancient low, take profits.
These levels have survived a full trading week without being touched - there's likely significant liquidity and institutional interest there.
**The Proximity Exit Rule**
> When you see ⚠️ proximity alerts on multiple levels above/below your position, tighten stops or scale out.
This is your "overhead environment" warning. You're in dangerous territory.
**The New Level Filter**
> Be cautious taking positions based solely on new levels (0-1 sessions). Wait for them to age or combine with other confluence.
Fresh levels haven't been tested by time. They're like unconfirmed support/resistance.
### 📊 Reading Market Structure
**Bullish Structure (🟢 in status row)**
- Unmitigated lows are aging and holding
- Price respecting the lower band
- Old lows below acting as strong support
- **Bias**: Look for long entries at lower levels
**Bearish Structure (🔴 in status row)**
- Unmitigated highs are aging and holding
- Price respecting the upper band
- Old highs above acting as strong resistance
- **Bias**: Look for short entries at higher levels
**The Tunnel Compression**
- When the Δ (delta) in the status row is small, levels are tight
- This often precedes a breakout
- **Trading**: Wait for breakout direction, then trade the break
### 🔄 Strat Integration
The indicator shows Strat patterns in the status row:
- **1** - Inside bar (consolidation)
- **2U** - Broke high only (bullish)
- **2D** - Broke low only (bearish)
- **3** - Broke both (wide range, volatility)
Use these with the unmitigated levels:
- **2U near old high** → Potential resistance, watch for rejection
- **2D near old low** → Potential support, watch for bounce
- **3 pattern** → High volatility, respect wider stops
---
## Settings & Customization
### 📅 Session & Timeframe Settings
**HL Interval** (Default: 15 minutes)
- The timeframe for high/low calculation
- **Lower (1m, 5m)**: More levels, more noise, good for scalping
- **Higher (30m, 1H, 4H)**: Fewer levels, stronger significance, good for swing trading
- **Recommendation for NQ/ES**: 15m or 30m for day trading, 1H for swing trading
**Session Age Threshold** (Default: 2)
- How many sessions before a level is considered "old"
- Lower = more levels classified as old
- Higher = stricter definition of significance
### 📊 Level Display Options
**Show Level Lines**
- Toggle: Display horizontal lines for each level
- **Turn off** if you prefer a cleaner chart and only want the table
**Show Level Labels**
- Toggle: Display price labels on the chart
- **Turn off** for minimal visual clutter
**Label Offset**
- Distance (in bars) from current price bar to place labels
- Increase if labels overlap with price action
**Level Line Width & Style**
- Customize visual appearance
- **Thin solid**: Minimal distraction
- **Thick dashed**: High visibility
### 🎨 Age-Based Color Coding
Customize colors for each age category (high and low separately):
- **New (0-1 sessions)**: Default bright red/green
- **Medium (2-3 sessions)**: Default medium intensity
- **Old (4+ sessions)**: Default dark red/blue
- **Ancient (7+ sessions)**: Default deep purple/teal
**Color Strategy Tips:**
- Keep ancient levels in highly contrasting colors
- Use opacity (transparency) if you want subtler lines
- Match your chart's color scheme for aesthetic coherence
### 🎯 Band Settings
**Band Mode**
- **1st-2nd** (Default): The primary "tunnel" between most recent levels
- **1st-3rd**: Wider band, more room for price action
- **2nd-3rd**: Band between less immediate levels
- **Disabled**: No bands, lines only
**Band Colors & Borders**
- Customize fill color and border separately
- **Tip**: Keep bands very transparent (90-95% transparency) to avoid obscuring price action
### ⚠️ Proximity Alert Settings
**Enable Proximity Alerts**
- Toggle: Turn on/off the warning system
- When enabled, levels within threshold distance show ⚠️ and turn yellow
**Alert Threshold** (Default: 5.0 points)
- Distance in points to trigger the alert
- **For NQ**: 5-10 points is reasonable
- **For ES**: 2-5 points is reasonable
- **For MES/MNQ**: Scale down proportionally
**Alert Highlight Color**
- The color lines/labels turn when proximity is triggered
- Default: Yellow (high visibility)
### 📋 Table Settings
**Show Table**
- Toggle: Display the dashboard table
**Table Location**
- Top Left, Top Right, Bottom Left, Bottom Right
- Choose based on your chart layout and other indicators
**Text Size**
- Tiny, Small, Normal, Large
- **Recommendation**: Normal for 1080p monitors, Small for 4K
**Show % Distance**
- Toggle: Add percentage distance column to table
- Useful for comparing relative distances across different price ranges
**Show Statistics Row**
- Toggle: Show total count of unmitigated highs/lows
- Format: "📊 15↑ / 12↓" (15 unmitigated highs, 12 unmitigated lows)
- Useful for gauging overall market structure
### ⚡ Performance Settings
**Enable Level Cleanup**
- Automatically remove very old levels to maintain performance
- **Keep on** unless you want unlimited history
**Max Lookback Levels** (Default: 10,000)
- Maximum number of levels to track
- 10,000 ≈ 6+ months of 15-minute bars
- **Increase** if you want more history
- **Decrease** if experiencing performance issues
**Max Boxes Per Band** (Default: 245)
- TradingView limit is 500 total boxes
- With 2 bands, 245 each = 490 total (safe maximum)
---
## Best Practices
### 🎯 Position Management
**1. Scaling In Near Old Levels**
```
Price approaching 5-session-old low:
- First position: 30% size at proximity alert (⚠️)
- Second position: 40% size at exact level
- Third position: 30% size if it shows strong rejection
```
**2. Scaling Out Near Ancient Levels**
```
Holding long position, approaching 8-session-old high:
- Exit 50% at proximity alert (⚠️)
- Exit 30% at exact level
- Trail stop on remaining 20%
```
### 🧠 Trading Psychology Integration
Drawing from principles in *The Mountain Is You*, this indicator helps you:
**1. Recognize Self-Sabotage Patterns**
- **The Premature Entry**: Entering before price reaches your planned level
- **Solution**: Set alerts at unmitigated levels, wait for proximity warnings
- **The Profit-Taking Problem**: Exiting too early from fear
- **Solution**: Identify the next unmitigated level and commit to holding until proximity alert
- **The Loss Holding**: Refusing to exit losing trades
- **Solution**: When price breaks through and mitigates your entry level, it's telling you the structure changed
**2. Building Better Habits**
The color-coded age system trains your brain to:
- Respect levels that have proven themselves over time
- Distinguish between noise (new levels) and structure (old levels)
- Make decisions based on objective data, not fear or greed
**3. Emotional Regulation**
The proximity alerts serve as:
- **Circuit breakers** - Forcing you to re-evaluate before dangerous zones
- **Permission to act** - Giving you objective signals to exit without second-guessing
- **Validation** - Confirming when you're in alignment with market structure
### 📝 Pre-Market Routine
**Daily Setup Checklist:**
1. ✅ Identify the 3 nearest unmitigated highs above current price
2. ✅ Identify the 3 nearest unmitigated lows below current price
3. ✅ Note which are ancient (7+) - these are your "no-go" zones
4. ✅ Check the tunnel width (Δ in status row) - tight or wide?
5. ✅ Set alerts at the 1st high and 1st low for proximity warnings
6. ✅ Plan: "If we go up, I exit at ___. If we go down, I enter at ___."
### 🔄 Timeframe Confluence
**Multi-Timeframe Strategy:**
Run the indicator on **three instances**:
- **15-minute** (short-term structure)
- **1-hour** (intermediate structure)
- **4-hour** (major structure)
**Strong Setup**: When all three timeframes show unmitigated levels converging at the same price zone.
**Example:**
- 15m: Old low at 21,400
- 1H: Ancient low at 21,398
- 4H: Ancient low at 21,395
- **Result**: 21,395-21,400 is a monster support zone
### ⚠️ What This Indicator Doesn't Do
**Not a Crystal Ball**
- It doesn't predict where price will go
- It shows you where price *hasn't been* and how long it's been avoided
- The trading decisions are still yours
**Not an Entry Signal Generator**
- It provides context and structure
- You need to combine it with your entry methodology (price action, indicators, order flow, etc.)
**Not Foolproof**
- Ancient levels get broken
- Proximity alerts can trigger early in strong trends
- The market doesn't "owe" you a reversal at any level
---
## Common Scenarios
### Scenario 1: "Level Cluster Ahead"
**Situation**: You're long at 21,400. The table shows:
- 1st High: 21,425 (2 sessions old)
- 2nd High: 21,428 (3 sessions old)
- 3rd High: 21,435 (6 sessions old)
**Interpretation**: There's a resistance cluster just 25-35 points away. The 6-session-old level is particularly significant.
**Action**:
- Set first profit target at 21,420 (before the cluster)
- Set second target at 21,426 (between 1st and 2nd)
- Trail remaining position, but be ready to exit on rejection at 21,435
**Cave Diving Analogy**: You're approaching an overhead section with limited clearance. Lighten your load (reduce position) before entering.
---
### Scenario 2: "Ancient Level Approaches"
**Situation**: The market is grinding higher. You see ⚠️ appear next to a 9-session-old high at 21,500.
**Interpretation**: This level has survived over a week without being touched. Massive potential liquidity zone.
**Action**:
- If long, this is your absolute exit zone. Take profits before or at level.
- If looking to short, wait for clear rejection (price taps and reverses)
- Don't try to buy the breakout until it clearly breaks and retests
**Cave Diving Analogy**: Your dive computer is beeping - you've reached your planned turn-back depth. No matter how interesting it looks ahead, honor your plan.
---
### Scenario 3: "Mitigated Levels Create New Structure"
**Situation**: Price breaks and mitigates the 1st High. The previous 2nd High becomes the new 1st High.
**Interpretation**: The structure just shifted. What was the 2nd level is now most relevant.
**Action**:
- Watch how price reacts to the newly-mitigated level
- If it holds below (acts as resistance), bearish
- If it reclaims and holds above (acts as support), bullish
- The NEW 1st High is your next target/resistance
**Cave Diving Analogy**: You've passed through a restriction - the cave layout ahead is different now. Update your mental map.
---
### Scenario 4: "Tight Tunnel, Upcoming Breakout"
**Situation**: The Δ in the status row shows 3.25 points (very tight). Bands are converging.
**Interpretation**: Price is consolidating between very close unmitigated levels. Breakout likely.
**Action**:
- Don't try to predict direction
- Set alerts above 1st High and below 1st Low
- When break occurs, trade the retest
- Expect volatility - use wider stops
**Cave Diving Analogy**: You're in a narrow passage. Movement will be sudden and directional once it starts.
---
### Scenario 5: "Imbalanced Structure"
**Situation**: The statistics row shows "📊 22↑ / 7↓"
**Interpretation**: There are many more unmitigated highs than lows. This suggests:
- Price has been declining (hitting lows, leaving highs behind)
- Potential bullish reversal zone (lots of overhead supply mitigated)
- Or continued bearish structure (resistance everywhere above)
**Action**:
- Look at the age of those 22 highs
- If mostly new (0-2 sessions): Just a recent downmove, not significant yet
- If many old/ancient: Strong overhead resistance, be cautious on longs
- Compare to price action: Is price respecting the remaining lows?
**Cave Diving Analogy**: You've swam deeper than your starting point - most of your markers are above you now. Are you planning the ascent or going deeper?
---
## Final Thoughts: The Philosophy
This indicator is built on a simple but powerful principle: **The market has memory, and that memory has weight.**
Every unmitigated level represents:
- Liquidity left behind
- Orders waiting to be filled
- Institutional interest potentially parked
- Psychological significance for participants
The longer a level remains unmitigated, the more "charged" it becomes. When price finally revisits it, something significant usually happens - either a strong reversal or a definitive break.
Your job as a trader isn't to predict which outcome will occur. Your job is to:
1. **Recognize** when you're approaching these charged zones
2. **Respect** them by adjusting position size and risk
3. **React** appropriately based on how price behaves at them
4. **Remember** that ancient levels (like ancient wisdom) deserve extra reverence
The Cave Diving Framework embedded in this indicator serves as a constant reminder: Trading, like cave diving, requires rigorous respect for environmental hazards, meticulous planning, and the discipline to turn back when your limits are reached.
**Every proximity alert is the market asking you**: *"Do you really want to go deeper?"*
Sometimes the answer is yes - when your setup, confluence, and risk management all align.
Often, the answer should be no - and that's the trader avoiding the accident that would have happened to the gambler.
---
### 🎯 Quick Reference Card
**Color System:**
- 🟢 Bright colors = New (0-1 sessions) = Shallow water
- 🟡 Medium colors = Medium (2-3 sessions) = Penetration depth
- 🔴 Dark colors = Old (4-6 sessions) = Deep dive zone
- 🟣 Deep dark colors = Ancient (7+ sessions) = Overhead environment
**Symbols:**
- ↑ ↑↑ ↑↑↑ ↑↑↑↑ ↑↑↑↑↑ = High levels (1st through 5th)
- ↓ ↓↓ ↓↓↓ ↓↓↓↓ ↓↓↓↓↓ = Low levels (1st through 5th)
- ⚠️ = Proximity alert (danger zone)
- 🟢 = Bullish structure
- 🔴 = Bearish structure
- Δ = Tunnel width (distance between 1st high and 1st low)
**Critical Rules:**
1. Never fight ancient levels (7+ sessions)
2. Respect proximity alerts (⚠️)
3. Scale out near old/ancient resistance
4. Wait for confluence when entering
5. Let mitigated levels prove their new role
---
**Remember**: The indicator gives you structure. The trading edge comes from your discipline in respecting that structure.
Trade safe, trade smart, and always know your exit before your entry. 🎯
---
*"You don't become your best self by denying your patterns. You become your best self by recognizing them, understanding them, and choosing differently." - Adapted from The Mountain Is You*
In trading: You don't become profitable by ignoring market structure. You become profitable by recognizing it, understanding it, and choosing your entries accordingly.

Position Trdaing Lines (2 entries + live PnL)Position Trading Lines (2 entries + live PnL) is a utility script designed to visually manage a manual position on the chart, with clear TP/SL levels and real-time profit & loss.
The script does not place orders. It is meant to help you simulate / track an existing or planned position.
Features
• Up to 2 trades on the same symbol
• Each trade has:
• Direction: Long / Short
• Position size (lot)
• Entry price
• Take Profit (T.Profit) price
• Stop Loss (S.Loss) price
• Entry shift in bars from the last candle (to align with past or future entries)
• Visual lines on the price chart
• Horizontal line at the entry price
• Horizontal line at Take Profit
• Horizontal line at Stop Loss
• Informative labels
• Entry label showing: direction, size and @ entry price
• TP and SL labels showing:
• T.Profit / S.Loss
• position size
• @ price
• estimated PnL at that level
• If both trades share the same TP or SL price, a single combined label is shown with the total size and total PnL.
• Commissions
• Global commission input (percentage over notional).
• Commission is included in all PnL calculations.
• Live PnL label
• Real-time combined PnL of the active trades, updated on the last bar.
• Color changes with sign (green for profit, red for loss).
• Selective PnL for Trade 2
• Trade 2 has a switch: “Count PnL in total”.
• You can keep Trade 2 visible on the chart but exclude it from the combined PnL until it is actually active.
This tool is useful for discretionary traders who want a clean visual representation of their position, R:R, and projected outcomes directly on the chart, without relying on the broker’s position panel.

Daily Levels [cryptalent]Daily High / Low / Mid / Open Levels is a session-based reference indicator designed to visualize key daily price levels directly on the chart.
This indicator automatically plots the Daily High, Daily Low, Daily Midpoint (High + Low / 2), and Daily Open as horizontal lines for each trading day. These levels help traders quickly identify important structural prices where liquidity, reactions, or acceptance often occur.
Key Features
Automatic Daily Levels
Plots Daily High (H), Low (L), Mid (M), and Open (O) using higher-timeframe daily data.
Levels update in real time as the current day develops.
Multi-Day History
Displays daily levels for a configurable number of past days.
Older levels are automatically removed to keep the chart clean.
Line Extension
Current day levels can be extended forward by a user-defined number of bars.
Useful for projecting intraday reaction zones and liquidity targets.
Visual Customization
Independent line width and color settings for each level.
Mid level is shown as a dashed line for quick visual distinction.
Labels & Price Tags
Optional letter labels (H / L / M / O) displayed near the extended levels.
Optional price labels showing the exact level values on the right side of the chart.
Labels update dynamically and only display for the active trading day.
Performance-Oriented Design
Efficient line and label management using arrays.
Automatically cleans up unused objects to stay within TradingView limits.
Use Cases
Identifying intraday support and resistance
Tracking daily range behavior
Monitoring mean reversion vs. range expansion
Aligning intraday execution with higher-timeframe structure
This indicator is particularly useful for traders who rely on market structure, session behavior, and objective price references rather than subjective trend lines.

Trendlines & SR ZonesIt's a comprehensive indicator (Pine Script v6) that represents two powerful technical analysis tools: automatic trendline detection based on pivot points and volume delta analysis with support/resistance zone identification. This overlay indicator helps traders identify potential trend directions and key price levels where significant buying or selling pressure has occurred.
Features: =
1. Price Trendlines
The indicator automatically identifies and draws trendlines based on pivot points, creating dynamic support and resistance levels.
Key Components:
Pivot Detection: Uses configurable left and right bars to identify significant pivot highs and lows
Trendline Filtering: Only draws downward-sloping resistance trendlines and upward-sloping support trendlines
Zone Creation: Creates filled zones around trendlines based on average price volatility
Automatic Management: Maintains only the 3 most recent significant trendlines to avoid chart clutter
Customization Options:
Left/Right Bars for Pivot: Adjust sensitivity of pivot detection (default: 10 bars each side)
Extension Length: Control how far trendlines extend past the second pivot (default: 50 bars)
Average Body Periods: Set the lookback period for volatility calculation (default: 100)
Tolerance Multiplier: Adjust the width of the trendline zones (default: 1.0)
Color Customization: Separate colors for high (resistance) and low (support) trendlines and their fills
2. Volume Delta % Bars
The indicator analyzes volume distribution across price levels to identify significant supply and demand zones.
Key Components:
Volume Profile Analysis: Divides the price range into rows and calculates volume delta at each level
Delta Visualization: Displays horizontal bars showing the percentage difference between buying and selling volume
Zone Identification: Automatically identifies the most significant supply and demand zones
Visual Integration: Connects volume delta bars with corresponding support/resistance zones on the price chart
Customization Options:
Lookback Period: Set the number of bars to analyze for volume (default: 200)
Price Rows: Control the granularity of the volume analysis (default: 50 rows)
Delta Sections: Adjust the number of horizontal delta bars displayed (default: 20)
Panel Appearance: Customize width, position, and direction of the delta panel
Zone Settings: Control the number of supply/demand zones and their extension (default: 3 zones)
How It Works-
Trendline Logic:
The script continuously scans for pivot highs and lows based on the specified left and right bars
When a pivot is detected, it creates a horizontal line at that price level
The script then looks for the previous pivot of the same type (high or low)
It connects these pivots with a trendline, extending it based on the user-specified setting
A parallel line is created to form a zone, with the distance based on average price volatility
The script filters out invalid trendlines (upward-sloping resistance and downward-sloping support). Only the 3 most recent trendlines are maintained to prevent chart clutter
Volume Delta Logic:
The script divides the price range over the lookback period into the specified number of rows
For each bar in the lookback period, it categorizes volume as bullish (close > open) or bearish (close < open). This volume is assigned to the appropriate price level based on the HLC3 price.
The price levels are grouped into sections, and the net delta (bullish - bearish volume) is calculated for each Horizontal bars are drawn to represent these delta percentages.
The most significant positive and negative deltas are identified and displayed as support and resistance zones. These zones are extended to the left on the price chart and connected to the delta panel with dotted lines.
Ideal Timeframes:
The indicator is versatile and can be used across multiple timeframes, but it performs optimally on specific timeframes depending on your trading style:
For Day Trading:
Optimal Timeframes: 15-minute to 1-hour charts
Why: These timeframes provide a good balance between noise reduction and sufficient volume data. The volume delta analysis is particularly effective on these timeframes as it captures intraday accumulation/distribution patterns while the trendlines remain reliable enough for intraday trading decisions.
For Swing Trading:
Optimal Timeframes: 1-hour to 4-hour charts
Why: These timeframes offer the best combination of reliable trendline formation and meaningful volume analysis. The trendlines on these timeframes are less prone to whipsaws, while the volume delta analysis captures multi-day trading sessions and institutional activity.
For Position Trading:
Optimal Timeframes: Daily and weekly charts
Why: On these higher timeframes, trendlines become extremely reliable as they represent significant market structure points. The volume delta analysis reveals longer-term accumulation and distribution patterns that can define major support and resistance zones for weeks or months.
Timeframe-Specific Adjustments:
Lower Timeframes (1-15 minutes):
Reduce left/right bars for pivots (5-8 bars)
Decrease lookback period for volume delta (50-100 bars)
Increase tolerance multiplier (1.2-1.5) to account for higher volatility
Higher Timeframes (Daily+):
Increase left/right bars for pivots (15-20 bars)
Extend lookback period for volume delta (300-500 bars)
Consider increasing the number of price rows (70-100) for more detailed volume analysis
Usage Guidelines-
For Trendline Analysis:
Use the trendlines as dynamic support and resistance levels
Price reactions at these levels can indicate potential trend continuation or reversal points
The filled zones around trendlines represent areas of price volatility or uncertainty
Consider the slope of the trendline as an indication of trend strength
For Volume Delta Analysis:
The horizontal delta bars show where buying or selling pressure has been concentrated
Green bars indicate areas where buying volume exceeded selling volume (demand)
Red bars indicate areas where selling volume exceeded buying volume (supply)
The highlighted supply and demand zones on the price chart represent significant price levels
These zones can act as future support or resistance areas as price revisits them
Customization Tips:
Trendline Sensitivity: Decrease left/right bars values to detect more pivots (more sensitive) or increase them for fewer, more significant pivots
Zone Width: Adjust the tolerance multiplier to make trendline zones wider or narrower based on your trading style
Volume Analysis: Increase the lookback period for a longer-term volume profile or decrease it for more recent activity
Visual Clarity: Adjust colors and transparency settings to match your chart theme and preferences
Conclusion:
This indicator provides traders with a comprehensive view of both trend dynamics and volume-based support/resistance levels. With these two analytical approaches, the indicator offers valuable insights for identifying potential entry and exit points, trend strength, and key price levels where significant market activity has occurred. The extensive customization options allow traders to adapt the indicator to various trading styles and timeframes, with optimal performance on 15-minute to daily charts depending on their trading horizon.
Chart Attached: NSE HINDZINC, EoD 12/12/25
DISCLAIMER: This information is provided for educational purposes only and should not be considered financial, investment, or trading advice. Please do boost if you like it. Happy Trading.

Smart Scalper V7 [Churn Filter]Indicator uses relative volume by time as well as ADX to highlight if volume is high to prevent trading in chop or being faked out.
Dec 1
Release Notes
How to Read the "Traffic Light" 🚦
You asked: "How do I work out if volume is higher or lower?" Look at the White Horizontal Line running across the indicator.
Height (Quantity):
Above the Line: Volume is High (The crowd is here).
Below the Line: Volume is Low (Everyone is at lunch).
Color (Quality):
🟢 Green: High Volume + Strong Trend. (Best for Entries).
🟡 Yellow: High Volume but NO Trend. This is usually a Reversal or a Trap. (Big fight, no winner yet).
🟠 Orange: Trending, but on Low Volume. The price is drifting. Don't trust it—it can snap back easily.
🔴 Red: Low Volume, No Trend. The "Kill Zone." Do not trade.

NY 9:30-9:35 High/Low Range📘 Script Description
This script automatically identifies and plots the high and low of the 5-minute candle formed between 9:30 AM and 9:35 AM New York time, which corresponds to the opening of the U.S. equity market.
The goal is to provide a clear reference level for intraday volatility, directional bias, and breakout levels.
🔍 Function Overview
■ 1. Detects the 9:30–9:35 NY Time Candle
The script converts chart timestamps into New York session time and automatically captures the 5-minute candle that forms between:
NY 9:30:00 → NY 9:35:00
■ 2. Automatically Draws Horizontal Lines
After identifying the high and low of this candle, the script draws:
High line → Red
Low line → Blue
Lines start exactly at the 9:30 timestamp
Lines extend 3 hours into the future (until NY 12:30)
Lines do not extend beyond 3 hours (prevents unwanted diagonal lines or lines from previous days)
■ 3. Label Display at NY 20:00
The script places a label at New York 20:00, marking:
“9:30 High” for the high line
“9:30 Low” for the low line
This allows you to instantly identify the key reference levels at the end of the trading day.
■ 4. Auto-Removal at NY 20:00
At NY 20:00, both the lines and the labels are automatically deleted.
No old lines remain on the chart, ensuring clarity and accuracy for each new trading day.
🎯 Purpose and Use Cases
This script is highly useful for:
Determining intraday direction after the NY open
Tracking volatility spikes at the U.S. equity market open
Identifying breakout levels
Using high/low as dynamic support and resistance throughout the day
Understanding market context during economic events or high-impact sessions
The 9:30–9:35 range is one of the most watched price zones in global markets, often serving as the day’s initial liquidity sweep.
📝 Key Features
Accurate New York time conversion
Clean horizontal lines (no previous-day diagonal lines)
Labels positioned clearly at NY 20:00
No unnecessary visuals—simple and effective
Lightweight script with minimal chart impact

RSI Profile [Kodexius]RSI Profile is an advanced technical indicator that turns the classic RSI into a distribution profile instead of a single oscillating line. Rather than only showing where the RSI is at the current bar, it displays where the RSI has spent most of its time or most of its volume over a user defined lookback period.
The script builds a histogram of RSI values between 0 and 100, splits that range into configurable bins, and then projects the result to the right side of the chart. This gives you a clear visual representation of the RSI structure, including the Point of Control (POC), the Value Area High (VAH), and the Value Area Low (VAL). The POC marks the RSI level with the highest activity, while VAH and VAL bracket the percentage based value area around it.
By combining standard RSI, a distribution profile, and value area logic, this tool lets you study RSI behavior statistically instead of only bar by bar. You can immediately see whether the current RSI reading is located inside the dominant zone, extended above it, or depressed below it, and whether the recent regime has been biased toward overbought, oversold, or neutral territory. This is particularly useful for swing traders, mean reversion systems, and anyone who wants to integrate RSI context into a more profile oriented workflow.
🔹 Features
1. RSI-Based Distribution Profile
-Builds a histogram of RSI values between 0 and 100.
-The RSI range is divided into a user-defined number of bins (e.g., 30 bins).
-Each bin represents a band of RSI values, such as 0–3.33, 3.33–6.66, ..., 96.66–100.
-For each bar in the lookback period, the script:
-Finds which bin the RSI value belongs to
Adds either:
-1.0 → if using time/frequency
-volume → if using volume-weighted RSI distribution
This creates a clear profile of where RSI has been concentrated over the chosen lookback window.
2. Time / Volume Weighting Mode
Under Profile Settings, you can choose:
-Weight by Volume = false
→ Profile is built using time spent at each RSI level (frequency).
-Weight by Volume = true
→ Profile is built using volume traded at each RSI level.
This flexibility allows you to decide whether you want:
-A pure momentum structure (time spent at each RSI)
-Or a participation-weighted structure (where higher-volume zones are emphasized)
3. Configurable Lookback & Resolution
-Profile Lookback: number of historical bars to analyze.
-Number of Bins: controls the resolution of the histogram:
Fewer bins → smoother, fewer gaps
More bins → more detail, but potentially more visual sparsity
-Profile Width (Bars): defines how wide the histogram extends into the future (visually), converted into time using average bar duration.
This provides a balance between performance, clarity, and visual density.
4. Value Area, POC, VAH, VAL
The script computes:
-POC (Point of Control)
→ The RSI bin with the highest total value (time or volume).
-Value Area (VA)
→ The range of RSI bins that contain a user-specified percentage of total activity (e.g., 70%).
-VAH & VAL
→ Upper and lower RSI boundaries of this Value Area.
These are then drawn as horizontal lines and labeled:
-POC line and label
-VAH line and label
-VAL line and label
This gives you a profile-style view similar to classical volume profile, but entirely on the RSI axis.
5. Color Coding & Visual Design
The histogram bars (boxes) are colored using a smart scheme:
-Below 30 RSI → Oversold zone, uses the Oversold Color (default: green).
-Above 70 RSI → Overbought zone, uses the Overbought Color (default: red).
-Between 30 and 70 RSI → Neutral zone, uses a gradient between:
A soft blue at lower mid levels
A soft orange at higher mid levels
Additional styling:
-POC bin is highlighted in bright yellow.
-Bins inside the Value Area → lower transparency (more solid).
-Bins outside the Value Area → higher transparency (faded).
This makes it easy to visually distinguish:
-Core RSI activity (VA)
-Extremes (oversold/overbought)
-The single dominant zone (POC)
🔹 Calculations
This section summarizes the core logic behind the script and highlights the main building blocks that power the profile.
1. Profile Structure and Bin Initialization
A custom Profile type groups together configuration, bins and drawing objects. During initialization, the script splits the 0 to 100 RSI range into evenly spaced bins, each represented by a Bin record:
method initBins(Profile p) =>
p.bins := array.new()
float step = 100.0 / p.binCount
for i = 0 to p.binCount - 1
float low = i * step
float high = (i + 1) * step
p.bins.push(Bin.new(low, high, 0.0, box(na)))
2. Filling the Profile Over the Lookback Window
On the last bar, the script clears previous drawings and walks backward through the selected lookback window. For each historical bar, it reads the RSI and volume series and feeds them into the profile:
if barstate.islast
myProfile.reset()
int start = math.max(0, bar_index - lookback)
int end = bar_index
for i = 0 to (end - start)
float r = rsi
float v = volume
if not na(r)
myProfile.add(r, v)
The add method converts each RSI value into a bin index and accumulates either a frequency count or the bar volume, depending on the chosen mode:
method add(Profile p, float rsiValue, float volumeValue) =>
int idx = int(rsiValue / (100.0 / p.binCount))
if idx >= p.binCount
idx := p.binCount - 1
if idx < 0
idx := 0
Bin targetBin = p.bins.get(idx)
float addedValue = p.useVolume ? volumeValue : 1.0
targetBin.value += addedValue
3. Finding POC and Building the Value Area
Inside the draw method, the script first scans all bins to determine the maximum value and the total sum. The bin with the highest value becomes the POC. The value area is then constructed by expanding from that center bin until the desired percentage of total activity is covered:
for in p.bins
totalVal += b.value
if b.value > maxVal
maxVal := b.value
pocIdx := i
float vaTarget = totalVal * (p.vaPercent / 100.0)
float currentVaVol = maxVal
int upIdx = pocIdx
int downIdx = pocIdx
while currentVaVol < vaTarget
float upVol = (upIdx < p.binCount - 1) ? p.bins.get(upIdx + 1).value : 0.0
float downVol = (downIdx > 0) ? p.bins.get(downIdx - 1).value : 0.0
if upVol == 0 and downVol == 0
break
if upVol >= downVol
upIdx += 1
currentVaVol += upVol
else
downIdx -= 1
currentVaVol += downVol

Week high / Week low (Mo–Fr)The indicator tracks the weekly high and low levels of the market starting from Monday 00:00 and updates them throughout the week until Friday. It draws horizontal lines across the chart representing:
Weekly High
Weekly Low
Each level also displays a label that can be positioned in different ways depending on user settings.
🧠 How it works step-by-step
1. Every Monday a new week starts
When a new week begins:
The script stores the current candle’s high as the initial weekHigh
And the current candle’s low as weekLow
Previous week's lines and labels are deleted
New horizontal lines are created and extended to the right
Labels (for high & low) are placed initially at the start of the week
2. During Monday–Friday
On every candle:
If a new higher price is reached → weekly high updates
If a new lower price is reached → weekly low updates
The horizontal line moves to the new value
A saved index remembers where that high/low was created
3. Label Position Control
The user can choose how labels should be anchored:
Mode Meaning
Update point Label stays where the high/low occurred
Right edge Label always moves to the current bar (right end of week)
Right offset Like Right edge but shifted further right by X bars
You can also customize:
label background color
label text color
label size
whether the label points up/down (above or below the line)
line color, style, and width
4. Weekend behavior
On Saturday, the script stops extending the lines, effectively freezing the weekly high and low for that completed week.
Summary
This indicator is useful for traders who want automatic weekly levels, visually clean chart structure, and customizable label placement. It tracks market structure weekly, keeps levels persistent across the chart, and lets you choose exactly how those levels appear.
If you want, I can also create:
✔ previous week high/low
✔ midline (50% of the range)
✔ alerts when price breaks the weekly high/low
✔ highlight liquidity sweeps

Gold AI RSI Monitor [Stacked + KNN]Here is a comprehensive description and user guide for the Gold AI RSI Monitor. You can copy and paste this into the "Description" field if you publish the script on TradingView, or save it for your own reference.
Gold AI RSI Monitor
🚀 Overview
The Gold AI RSI Monitor is a next-generation dashboard designed specifically for trading volatile assets like Gold (XAUUSD). It completely reimagines the traditional RSI by "stacking" 10 different timeframes (from 1-minute to Monthly) into a single, vertical view.
Integrated into this dashboard is a K-Nearest Neighbors (KNN) Machine Learning algorithm. This AI analyzes historical price action to find patterns similar to the current market and predicts the next likely move with a confidence score.
📊 Visual Guide: How to Read the Chart
1. The "Stacked" Lanes Instead of switching timeframes constantly, this indicator displays them all at once using vertical offsets.
Bottom Lane (0-100): 1-Minute RSI
Middle Lanes: 5m, 15m, 30m, 1H, 2H, 4H, Daily
Top Lane (900-1000): Monthly RSI
2. Gradient Color System The RSI lines change color based on momentum strength:
🔴 Red: Oversold / Bearish (Approaching 30 or lower)
🟡 Yellow: Neutral (Around 50)
🟢 Green: Overbought / Bullish (Approaching 70 or higher)
3. Tracker Lines Each timeframe has a dotted horizontal line extending to the right. This allows you to instantly see the exact RSI value for every timeframe without squinting.
🤖 The AI Engine (KNN)
The "AI" component uses a K-Nearest Neighbors algorithm.
Learning: It scans the last 1,000 bars of history.
Matching: It finds the 5 historical moments that look mathematically identical to the current market conditions (based on RSI and Volatility).
Predicting: It checks if price went UP or DOWN after those historical matches.
The Signals:
Buying Signal: If the majority of historical matches resulted in a price increase, the AI triggers a BUY.
Selling Signal: If the majority resulted in a drop, the AI triggers a SELL.
🎯 How to Trade with This Indicator
1. The "Crosshair" Signal
When the AI detects a high-probability setup, a massive Crosshair appears on your chart:
Green Crosshair: Strong BUY signal.
Red Crosshair: Strong SELL signal.
Note: The crosshair consists of a thick vertical line and a dashed horizontal line intersecting at the signal candle.
2. Timeframe Alignment (Confluence)
Do not rely on the AI alone. Look at the stacked RSIs:
Strong Long: The AI shows a Green Crosshair AND the lower timeframes (1m, 5m, 15m) are all turning Green/upward.
Strong Short: The AI shows a Red Crosshair AND the lower timeframes are turning Red/downward.
3. Support & Resistance Zones
Bottom Dotted Line (30): Support. If RSI hits this and turns up, it's a buying opportunity.
Top Dotted Line (70): Resistance. If RSI hits this and turns down, it's a selling opportunity.
⚙️ Settings Guide
RSI Length: Default is 14. Lower (e.g., 7) makes it faster/choppier; higher (e.g., 21) makes it smoother.
Enable AI Signals: Toggles the KNN calculation on/off.
Neighbors (K): How many historical matches to check. Default is 5.
Increase to 9-10 for fewer, more conservative signals.
Decrease to 3 for faster, more aggressive signals.
AI Timeframe: CRITICAL SETTING.
If left empty, the AI calculates based on your current chart.
Recommendation: For Gold scalping, set this to 15m or 1h. This ensures the AI looks at the bigger trend even if you are zooming in on the 1-minute chart.
⚠️ Disclaimer
This tool is for educational and analytical purposes. The "AI" is a statistical probability algorithm based on past performance, which is not indicative of future results. Always manage your risk.

Final Scalping Strategy - RELAXED ENTRY, jangan gopoh braderEMA Scalping System (MTF) Guide (1HR direction, 15 min entry)
Objective
To capture small, consistent profits by entering trades when 15-minute momentum aligns with the 1-hour trend.
Trades are executed only during high-liquidity London and New York sessions to increase the probability of execution and success.
Strategy Setup
Chart Timeframe (Execution): 15-Minute (M15).
Trend Filter (HTF): 1-Hour (H1) chart data is used for the long-term EMA.
Long-Term Trend Filter: 50-Period EMA (based on H1 data).
Short-Term Momentum Signal: 20-Period EMA (based on M15 data).
Risk
Metric: 14-period ATR for dynamic Stop Loss calculation.
✅ Trading Rules🟢
Long (Buy) Entry Conditions
Session: Must be within the London (0800-1700 GMT) or New York (1300-2200 GMT) sessions.
HTF Trend: Current price must be above the 1-Hour EMA 50.
Momentum Signal: Price crosses above the 15-Minute EMA 20.
Confirmation: The bar immediately following the crossover must close above the 15-Minute EMA 20.
Ent
ry: A market order is executed on the close of the confirmation candle.
🔴 Short (Sell) Entry Conditions
Session: Must be within the London (0800-1700 GMT) or New York (1300-2200 GMT) sessions.
HTF Trend: Current price must be below the 1-Hour EMA 50.
Momentum Signal: Price crosses below the 15-Minute EMA 20.
Confirmation: The bar immediately following the crossover must close below the 15-Minute EMA 20.
Entry: A market order is executed on the close of the confirmation candle.
🛑 Trade Management & Exits
Stop Loss (SL): Placed dynamically at 2.0 times the 14-period ATR distance from the entry candle's low (for Buys) or high (for Sells).
Take Profit (TP): Placed dynamically to achieve a 1.5 Risk-Reward Ratio (RR) (TP distance = 1.5 x SL d
istance).
📊 On-Chart Visuals
Detailed Labels: A box appears on the entry bar showing the action, SL/TP prices, Risk/Reward in Pips, and the exact R:R ratio.
Horizontal Lines: Dashed lines display the calculated SL (Red) and TP (Green) levels while the trade is active.
Background: The chart background is shaded to highlight the active London and New York tradi
ng sessions.

Realtime Squeeze Box [CHE] Realtime Squeeze Box — Detects lowvolatility consolidation periods and draws trimmed price range boxes in realtime to highlight potential breakout setups without clutter from outliers.
Summary
This indicator identifies "squeeze" phases where recent price volatility falls below a dynamic baseline threshold, signaling potential energy buildup for directional moves. By requiring a minimum number of consecutive bars in squeeze, it reduces noise from fleeting dips, making signals more reliable than simple threshold crosses. The core innovation is realtime box visualization: during active squeezes, it builds and updates a box capturing the price range while ignoring extreme values via quantile trimming, providing a cleaner view of consolidation bounds. This differs from static volatility bands by focusing on trimmed ranges and suppressing overlapping boxes, which helps traders spot genuine setups amid choppy markets. Overall, it aids in anticipating breakouts by combining volatility filtering with visual containment of price action.
Motivation: Why this design?
Traders often face whipsaws during brief volatility lulls that mimic true consolidations, leading to premature entries, or miss setups because standard volatility measures lag in adapting to changing market regimes. This design addresses that by using a hold requirement on consecutive lowvolatility bars to denoise signals, ensuring only sustained squeezes trigger visuals. The core idea—comparing rolling standard deviation to a smoothed baseline—creates a responsive yet stable filter for lowenergy periods, while the trimmed box approach isolates the core price cluster, making it easier to gauge breakout potential without distortion from spikes.
What’s different vs. standard approaches?
Reference baseline: Traditional squeeze indicators like the Bollinger Band Squeeze or TTM Squeeze rely on fixed multiples of bands or momentum oscillators crossing zero, which can fire on isolated bars or ignore range compression nuances.
Architecture differences:
Realtime box construction that updates barbybar during squeezes, using arrays to track and trim price values.
Quantilebased outlier rejection to define box bounds, focusing on the bulk of prices rather than full range.
Overlap suppression logic that skips redundant boxes if the new range intersects heavily with the prior one.
Hold counter for consecutive bar validation, adding persistence before signaling.
Practical effect: Charts show fewer, more defined orange boxes encapsulating tight price action, with a horizontal line extension marking the midpoint postsqueeze—visibly reducing clutter in sideways markets and highlighting "coiled" ranges that standard plots might blur with full highs/lows. This matters for quicker visual scanning of multitimeframe setups, as boxes selflimit to recent history and avoid piling up.
How it works (technical)
The indicator starts by computing a rolling average and standard deviation over a userdefined length on the chosen source price series. This deviation measure is then smoothed into a baseline using either a simple or exponential average over a longer window, serving as a reference for normal volatility. A squeeze triggers when the current deviation dips below this baseline scaled by a multiplier less than one, but only after a minimum number of consecutive bars confirm it, which resets the counter on breaks.
Upon squeeze start, it clears a buffer and begins collecting source prices barbybar, limited to the first few bars to keep computation light. For visualization, if enabled, it sorts the buffer and finds a quantile threshold, then identifies the minimum value at or below that threshold to set upper and lower box bounds—effectively clamping the range to exclude tails above the quantile. The box draws from the start bar to the current one, updating its right edge and levels dynamically; if the new bounds overlap significantly with the last completed box, it suppresses drawing to avoid redundancy.
Once the hold limit or squeeze ends, the box freezes: its final bounds become the last reference, a midpoint line extends rightward from the end, and a tiny circle label marks the point. Buffers and states reset on new squeezes, with historical boxes and lines capped to prevent overload. All logic runs on every bar but uses confirmed historical data for calculations, with realtime updates only affecting the active box's position—no future peeking occurs. Initialization seeds with null values, building states progressively from the first bars.
Parameter Guide
Source: Selects the price series (e.g., close, hl2) for deviation and box building; influences sensitivity to wicks or bodies. Default: close. Tradeoffs/Tips: Use hl2 for balanced range view in volatile assets; stick to close for pure directional focus—test on your timeframe to avoid oversmoothing trends.
Length (Mean/SD): Sets window for average and deviation calculation; shorter values make detection quicker but noisier. Default: 20. Tradeoffs/Tips: Increase to 30+ for stability in higher timeframes, reducing false starts; below 10 risks overreacting to singlebar noise.
Baseline Length: Defines smoothing window for the deviation baseline; longer periods create a steadier reference, filtering regime shifts. Default: 50. Tradeoffs/Tips: Pair with Length at 1:2 ratio for calm markets; shorten to 30 if baselines lag during fast volatility drops, but watch for added whips.
Squeeze Multiplier (<1.0): Scales the baseline downward to set the squeeze threshold; lower values tighten criteria for rarer, stronger signals. Default: 0.8. Tradeoffs/Tips: Tighten to 0.6 for highvol assets like crypto to cut noise; loosen to 0.9 in forex for more frequent but shallower setups—balances hit rate vs. depth.
Baseline via EMA (instead of SMA): Switches baseline smoothing to exponential for faster adaptation to recent changes vs. equalweighted simple average. Default: false. Tradeoffs/Tips: Enable in trending markets for quicker baseline drops; disable for uniform history weighting in rangebound conditions to avoid overreacting.
SD: Sample (len1) instead of Population (len): Adjusts deviation formula to divide by length minus one for smallsample bias correction, slightly inflating values. Default: false. Tradeoffs/Tips: Use sample in short windows (<20) for more conservative thresholds; population suits long looks where bias is negligible, keeping signals tighter.
Min. Hold Bars in Squeeze: Requires this many consecutive squeeze bars before confirming; higher denoise but may clip early setups. Default: 1. Tradeoffs/Tips: Bump to 35 for intraday to filter ticks; keep at 1 for swings where quick consolidations matter—trades off timeliness for reliability.
Debug: Plot SD & Threshold: Toggles lines showing raw deviation and threshold for visual backtesting of squeeze logic. Default: false. Tradeoffs/Tips: Enable during tuning to eyeball crossovers; disable live to declutter—great for verifying multiplier impact without alerts.
Tint Bars when Squeeze Active: Overlays semitransparent color on bars during open box phases for quick squeeze spotting. Default: false. Tradeoffs/Tips: Pair with low opacity for subtlety; turn off if using boxes alone, as tint can obscure candlesticks in dense charts.
Tint Opacity (0..100): Controls background tint strength during active squeezes; higher values darken for emphasis. Default: 85. Tradeoffs/Tips: Dial to 60 for light touch; max at 100 risks hiding price action—adjust per chart theme for visibility.
Stored Price (during Squeeze): Price series captured in the buffer for box bounds; defaults to source but allows customization. Default: close. Tradeoffs/Tips: Switch to high/low for wider boxes in gappy markets; keep close for midline focus—impacts trim effectiveness on outliers.
Quantile q (0..1): Fraction of sorted prices below which tails are cut; higher q keeps more data but risks including spikes. Default: 0.718. Tradeoffs/Tips: Lower to 0.5 for aggressive trim in noisy assets; raise to 0.8 for fuller ranges—tune via debug to match your consolidation depth.
Box Fill Color: Sets interior shade of squeeze boxes; semitransparent for layering. Default: orange (80% trans.). Tradeoffs/Tips: Soften with more transparency in multiindicator setups; bold for standalone use—ensures boxes pop without overwhelming.
Box Border Color: Defines outline hue and solidity for box edges. Default: orange (0% trans.). Tradeoffs/Tips: Match fill for cohesion or contrast for edges; thin width keeps it clean—helps delineate bounds in zoomed views.
Keep Last N Boxes: Limits historical boxes/lines/labels to this count, deleting oldest for performance. Default: 10. Tradeoffs/Tips: Increase to 50 for weekly reviews; set to 0 for unlimited (risks lag)—balances history vs. speed on long charts.
Draw Box in Realtime (build/update): Enables live extension of boxes during squeezes vs. waiting for end. Default: true. Tradeoffs/Tips: Disable for confirmedonly views to mimic backtests; enable for proactive trading—adds minor repaint on live bars.
Box: Max First N Bars: Caps buffer collection to initial squeeze bars, freezing after for efficiency. Default: 15. Tradeoffs/Tips: Shorten to 510 for fast intraday; extend to 20 in dailies—prevents bloated arrays but may truncate long squeezes.
Reading & Interpretation
Squeeze phases appear as orange boxes encapsulating the trimmed price cluster during lowvolatility holds—narrow boxes signal tight consolidations, while wider ones indicate looser ranges within the threshold. The box's top and bottom represent the quantilecapped high and low of collected prices, with the interior fill shading the containment zone; ignore extremes outside for "true" bounds. Postsqueeze, a solid horizontal line extends right from the box's midpoint, acting as a reference level for potential breakout tests—drifting prices toward or away from it can hint at building momentum. Tiny orange circles at the line's start mark completion points for easy scanning. Debug lines (if on) show deviation hugging or crossing the threshold, confirming hold logic; a persistent hug below suggests prolonged calm, while spikes above reset counters.
Practical Workflows & Combinations
Trend following: Enter long on squeezeend close above the box top (or midpoint line) confirmed by higher high in structure; filter with rising 50period average to avoid countertrend traps. Use boxes as support/resistance proxies—short below bottom in downtrends.
Exits/Stops: Trail stops to the box midpoint during postsqueeze runs for conservative holds; go aggressive by exiting on retest of opposite box side. If debug shows repeated threshold grazes, tighten stops to curb drawdowns in ranging followups.
Multiasset/MultiTF: Defaults work across stocks, forex, and crypto on 15min+ frames; scale Length proportionally (e.g., x2 on hourly). Layer with highertimeframe boxes for confluence—e.g., daily squeeze + 1H box for entry timing. (Unknown/Optional: Specific multiTF scaling recipes beyond proportional adjustment.)
Behavior, Constraints & Performance
Repaint/confirmation: Core calculations use historical closes, confirming on bar close; active boxes repaint their right edge and levels live during squeezes if enabled, but freeze irrevocably on hold limit or end—mitigates via barbybar buffer adds without future leaks. No lookahead indexes.
security()/HTF: None used, so no external timeframe repaints; all native to chart resolution.
Resources: Caps at 300 boxes/lines/labels total; small arrays (up to 20 elements) and short loops in sorting/minfinding keep it light—suitable for 10k+ bar charts without throttling. Persistent variables track state across bars efficiently.
Known limits: May lag on ultrasharp volatility spikes due to baseline smoothing; gaps or thin markets can skew trims if buffer hits cap early; overlaps suppress visuals but might hide chained squeezes—(Unknown/Optional: Edge cases in nonstandard sessions).
Sensible Defaults & Quick Tuning
Start with defaults for most liquid assets on 1Hdaily: Length 20, Multiplier 0.8, Hold 1, Quantile 0.718—yields balanced detection without excess noise. For too many false starts (choppy charts), increase Hold to 3 and Baseline Length to 70 for stricter confirmation, reducing signals by 3050%. If squeezes feel sluggish or miss quick coils, shorten Length to 14 and enable EMA baseline for snappier adaptation, but monitor for added flips. In highvol environments like options, tighten Multiplier to 0.6 and Quantile to 0.6 to focus on core ranges; reverse for calm pairs by loosening to 0.95. Always backtest tweaks on your asset's history.
What this indicator is—and isn’t
This is a volatilityfiltered visualization tool for spotting and bounding consolidation phases, best as a signal layer atop price action and trend filters—not a standalone predictor of direction or strength. It highlights setups but ignores volume, momentum, or news context, so pair with discreteness rules like higher highs/lows. Never use it alone for entries; always layer risk management, such as 12% stops beyond box extremes, and position sizing based on account drawdown tolerance.
Disclaimer
The content provided, including all code and materials, is strictly for educational and informational purposes only. It is not intended as, and should not be interpreted as, financial advice, a recommendation to buy or sell any financial instrument, or an offer of any financial product or service. All strategies, tools, and examples discussed are provided for illustrative purposes to demonstrate coding techniques and the functionality of Pine Script within a trading context.
Any results from strategies or tools provided are hypothetical, and past performance is not indicative of future results. Trading and investing involve high risk, including the potential loss of principal, and may not be suitable for all individuals. Before making any trading decisions, please consult with a qualified financial professional to understand the risks involved.
By using this script, you acknowledge and agree that any trading decisions are made solely at your discretion and risk.
Do not use this indicator on HeikinAshi, Renko, Kagi, PointandFigure, or Range charts, as these chart types can produce unrealistic results for signal markers and alerts.
Best regards and happy trading
Chervolino
